News
As Economy Improves Traffic Congestion Increases To Surpass Pre-Recession Levels
August 27, 2015
 ChatGPT
 Grok
Grok Perplexity
 Claude
TAGS: Inrix, Traffic Congestion, fleet news, vending route, coin machine operator |
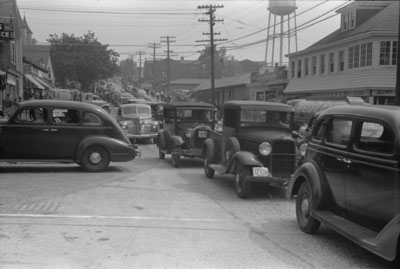 |
JUST LIKE OLD TIMES:Traffic congestion in urban areas has now surpassed peak levels set in 2007. According to the Urban Mobility Scorecard, low gas prices, increased employment, and a sagging infrastructure are to blame. [Photo: Library of Congress] |
According to TTI's 2015 Urban Mobility Scorecard, travel delays due to traffic congestion caused drivers to waste more than three billion gallons of fuel and kept travelers stuck in their cars for nearly seven billion extra hours. That's 42 hours per rush-hour commuter with a total price tag of $160 billion, or $960 per commuter.
Topping the list of gridlocked cities is Washington, DC, with 82 hours of delay per commuter per year, followed by Los Angeles (80 hours), San Francisco (78 hours), New York (74 hours), and San Jose (67 hours).
Not surprisingly, cities with the fastest-growing economies and rapid job growth suffered the most increased congestion. As the report noted, congestion increased in 61 of the nation's 101 largest cities from 2012 to 2013. However, by 2014 nearly all of those same cities -- 95 out of 101 -- experienced greater congestion.
Cities of all sizes are re-experiencing the same challenges seen before the start of the recession. These are due, at least in part, to increased urban populations and lower fuel prices outpacing the nation's ability to build infrastructure. Recent data from the U.S. Department of Transportation shows that Americans have driven more than three trillion miles in the past 12 months. That's a new record, surpassing the 2007 peak set just before the global financial crisis.
"Our growing traffic problem is too massive for any one entity to handle -- state and local agencies can't do it alone," said Tim Lomax, the report's co-author and Regents Fellow at TTI. "Businesses can give their employees more flexibility in where, when and how they work, individual workers can adjust their commuting patterns, and we can have better thinking when it comes to long-term land-use planning. This problem calls for a classic 'all-hands-on-deck' approach."
Findings in the Urban Mobility Scorecard are drawn from traffic speed data collected by Inrix on 1.3 million miles of urban streets and highways, along with highway performance data from the Federal Highway Administration.
Related Media
Subscribe
Get the latest news and resources from Vending Times.